
Wettest counties in Ohio

Rain, sleet, snow, hail, wintry mix. Precipitation takes on many forms, and the degree to which climate change affects precipitation levels comes down to something almost everyone learns about in school—Earth's water cycle. A system in endless motion, the water cycle traces the process through which water exists in its three primary phases—liquid, solid, and gas—as it moves perpetually between the Earth and its atmosphere.
Increases in precipitation frequency and intensity are markers of climate change. When temperatures rise and oceans grow warmer, the amount of water that evaporates into the atmosphere—and the speed at which it does so—also increases. As atmospheric circulation carries the moisture-rich air over land or pushes it into a storm system, heavy rain or snow is often the result.
The continental U.S. on average received about 30 inches of precipitation between March 2022 and February 2023. Traditionally "wet" regions—such as Washington state and Alaska in the northwest and Georgia and Mississippi in the southeast—continue to have some of the rainiest counties in the United States. Other areas such as Oklahoma, Kansas, and Nebraska, as well as pockets of the South and of California, experience the opposite extreme: drought, also largely a product of climate change.
Stacker cited data from the National Centers for Environmental Information to identify the counties in Ohio that receive the most precipitation through rain, sleet, or snow. Counties are ranked by five-year precipitation averages in inches as of February 2023 with rainfall over the past year serving as a tiebreaker. Supplementary data on how last year's precipitation compares to the 100-year average for the area is also included.

#50. Montgomery County
- Five-year precipitation average: 43.47 inches
- Precipitation over the past year: 37.11 inches (#46 rainiest year since 1895)
- Precipitation compared to 1901-2000 average: -1.76 inches below norm

#49. Mahoning County
- Five-year precipitation average: 43.48 inches
- Precipitation over the past year: 36.39 inches (#48 rainiest year since 1895)
- Precipitation compared to 1901-2000 average: -0.74 inches below norm
#48. Ashtabula County
- Five-year precipitation average: 43.57 inches
- Precipitation over the past year: 41.19 inches (#70 rainiest year since 1895)
- Precipitation compared to 1901-2000 average: 1.66 inches above norm
#47. Delaware County
- Five-year precipitation average: 43.80 inches
- Precipitation over the past year: 39.38 inches (#66 rainiest year since 1895)
- Precipitation compared to 1901-2000 average: 1.49 inches above norm

#46. Morrow County
- Five-year precipitation average: 43.84 inches
- Precipitation over the past year: 39.67 inches (#64 rainiest year since 1895)
- Precipitation compared to 1901-2000 average: 0.57 inches above norm

#45. Tuscarawas County
- Five-year precipitation average: 44.17 inches
- Precipitation over the past year: 41.25 inches (#80 rainiest year since 1895)
- Precipitation compared to 1901-2000 average: 2.79 inches above norm

#44. Greene County
- Five-year precipitation average: 44.17 inches
- Precipitation over the past year: 38.79 inches (#50 rainiest year since 1895)
- Precipitation compared to 1901-2000 average: -0.82 inches below norm
#43. Holmes County
- Five-year precipitation average: 44.97 inches
- Precipitation over the past year: 41.34 inches (#82 rainiest year since 1895)
- Precipitation compared to 1901-2000 average: 3.20 inches above norm
#42. Geauga County
- Five-year precipitation average: 45.12 inches
- Precipitation over the past year: 43.05 inches (#93 rainiest year since 1895)
- Precipitation compared to 1901-2000 average: 4.49 inches above norm

#41. Preble County
- Five-year precipitation average: 45.18 inches
- Precipitation over the past year: 38.00 inches (#45 rainiest year since 1895)
- Precipitation compared to 1901-2000 average: -1.50 inches below norm

#40. Trumbull County
- Five-year precipitation average: 45.25 inches
- Precipitation over the past year: 38.38 inches (#58 rainiest year since 1895)
- Precipitation compared to 1901-2000 average: 0.70 inches above norm

#39. Fayette County
- Five-year precipitation average: 45.30 inches
- Precipitation over the past year: 41.97 inches (#75 rainiest year since 1895)
- Precipitation compared to 1901-2000 average: 2.59 inches above norm
#38. Champaign County
- Five-year precipitation average: 45.30 inches
- Precipitation over the past year: 42.23 inches (#90 rainiest year since 1895)
- Precipitation compared to 1901-2000 average: 4.38 inches above norm

#37. Franklin County
- Five-year precipitation average: 45.53 inches
- Precipitation over the past year: 40.40 inches (#69 rainiest year since 1895)
- Precipitation compared to 1901-2000 average: 2.16 inches above norm
#36. Pickaway County
- Five-year precipitation average: 45.60 inches
- Precipitation over the past year: 39.27 inches (#56 rainiest year since 1895)
- Precipitation compared to 1901-2000 average: 0.09 inches above norm

#35. Knox County
- Five-year precipitation average: 45.62 inches
- Precipitation over the past year: 42.41 inches (#87 rainiest year since 1895)
- Precipitation compared to 1901-2000 average: 3.06 inches above norm

#34. Coshocton County
- Five-year precipitation average: 45.66 inches
- Precipitation over the past year: 40.07 inches (#65 rainiest year since 1895)
- Precipitation compared to 1901-2000 average: 1.30 inches above norm
#33. Clark County
- Five-year precipitation average: 45.82 inches
- Precipitation over the past year: 42.45 inches (#84 rainiest year since 1895)
- Precipitation compared to 1901-2000 average: 3.85 inches above norm

#32. Carroll County
- Five-year precipitation average: 45.92 inches
- Precipitation over the past year: 43.41 inches (#96 rainiest year since 1895)
- Precipitation compared to 1901-2000 average: 4.67 inches above norm
#31. Fairfield County
- Five-year precipitation average: 45.96 inches
- Precipitation over the past year: 41.17 inches (#65 rainiest year since 1895)
- Precipitation compared to 1901-2000 average: 1.48 inches above norm

#30. Hocking County
- Five-year precipitation average: 46.14 inches
- Precipitation over the past year: 41.00 inches (#64 rainiest year since 1895)
- Precipitation compared to 1901-2000 average: 0.74 inches above norm

#29. Butler County
- Five-year precipitation average: 46.18 inches
- Precipitation over the past year: 40.89 inches (#57 rainiest year since 1895)
- Precipitation compared to 1901-2000 average: 0.34 inches above norm

#28. Guernsey County
- Five-year precipitation average: 46.20 inches
- Precipitation over the past year: 41.82 inches (#77 rainiest year since 1895)
- Precipitation compared to 1901-2000 average: 2.51 inches above norm
#27. Warren County
- Five-year precipitation average: 46.68 inches
- Precipitation over the past year: 40.12 inches (#53 rainiest year since 1895)
- Precipitation compared to 1901-2000 average: -1.38 inches below norm

#26. Muskingum County
- Five-year precipitation average: 46.71 inches
- Precipitation over the past year: 41.59 inches (#78 rainiest year since 1895)
- Precipitation compared to 1901-2000 average: 2.57 inches above norm

#25. Harrison County
- Five-year precipitation average: 46.75 inches
- Precipitation over the past year: 43.79 inches (#96 rainiest year since 1895)
- Precipitation compared to 1901-2000 average: 4.36 inches above norm
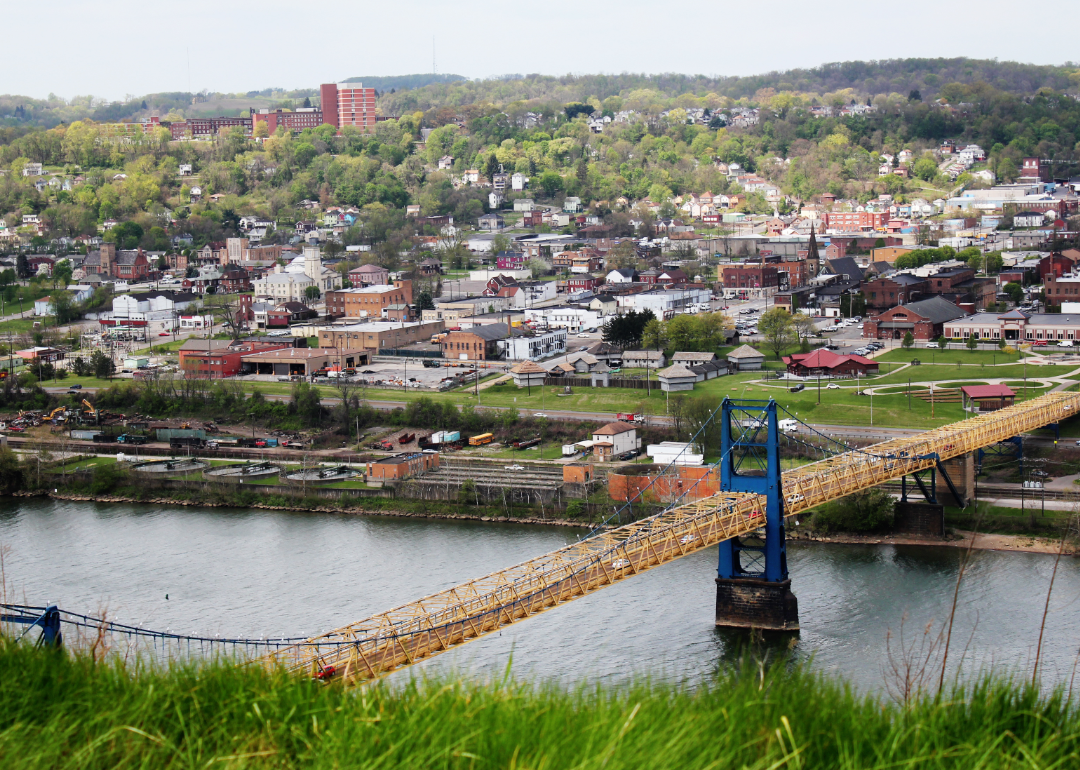
#24. Jefferson County
- Five-year precipitation average: 46.97 inches
- Precipitation over the past year: 44.60 inches (#107 rainiest year since 1895)
- Precipitation compared to 1901-2000 average: 5.81 inches above norm

#23. Columbiana County
- Five-year precipitation average: 47.11 inches
- Precipitation over the past year: 42.47 inches (#96 rainiest year since 1895)
- Precipitation compared to 1901-2000 average: 4.61 inches above norm

#22. Clinton County
- Five-year precipitation average: 47.13 inches
- Precipitation over the past year: 40.80 inches (#51 rainiest year since 1895)
- Precipitation compared to 1901-2000 average: -1.34 inches below norm

#21. Noble County
- Five-year precipitation average: 47.28 inches
- Precipitation over the past year: 42.73 inches (#73 rainiest year since 1895)
- Precipitation compared to 1901-2000 average: 2.23 inches above norm

#20. Licking County
- Five-year precipitation average: 47.30 inches
- Precipitation over the past year: 43.75 inches (#93 rainiest year since 1895)
- Precipitation compared to 1901-2000 average: 4.11 inches above norm
#19. Morgan County
- Five-year precipitation average: 47.75 inches
- Precipitation over the past year: 41.79 inches (#74 rainiest year since 1895)
- Precipitation compared to 1901-2000 average: 2.15 inches above norm
#18. Vinton County
- Five-year precipitation average: 47.76 inches
- Precipitation over the past year: 40.80 inches (#58 rainiest year since 1895)
- Precipitation compared to 1901-2000 average: 0.15 inches above norm

#17. Perry County
- Five-year precipitation average: 47.93 inches
- Precipitation over the past year: 42.08 inches (#77 rainiest year since 1895)
- Precipitation compared to 1901-2000 average: 2.72 inches above norm

#16. Ross County
- Five-year precipitation average: 47.95 inches
- Precipitation over the past year: 41.28 inches (#62 rainiest year since 1895)
- Precipitation compared to 1901-2000 average: 1.12 inches above norm
#15. Washington County
- Five-year precipitation average: 48.03 inches
- Precipitation over the past year: 42.48 inches (#69 rainiest year since 1895)
- Precipitation compared to 1901-2000 average: 1.72 inches above norm
#14. Gallia County
- Five-year precipitation average: 48.07 inches
- Precipitation over the past year: 40.39 inches (#49 rainiest year since 1895)
- Precipitation compared to 1901-2000 average: -0.78 inches below norm

#13. Hamilton County
- Five-year precipitation average: 48.07 inches
- Precipitation over the past year: 41.67 inches (#60 rainiest year since 1895)
- Precipitation compared to 1901-2000 average: 0.83 inches above norm

#12. Athens County
- Five-year precipitation average: 48.11 inches
- Precipitation over the past year: 41.28 inches (#69 rainiest year since 1895)
- Precipitation compared to 1901-2000 average: 1.19 inches above norm

#11. Jackson County
- Five-year precipitation average: 48.51 inches
- Precipitation over the past year: 40.82 inches (#58 rainiest year since 1895)
- Precipitation compared to 1901-2000 average: -0.34 inches below norm
#10. Lawrence County
- Five-year precipitation average: 48.73 inches
- Precipitation over the past year: 40.47 inches (#47 rainiest year since 1895)
- Precipitation compared to 1901-2000 average: -1.46 inches below norm
#9. Meigs County
- Five-year precipitation average: 48.96 inches
- Precipitation over the past year: 42.06 inches (#66 rainiest year since 1895)
- Precipitation compared to 1901-2000 average: 1.50 inches above norm
#8. Scioto County
- Five-year precipitation average: 49.04 inches
- Precipitation over the past year: 40.85 inches (#56 rainiest year since 1895)
- Precipitation compared to 1901-2000 average: -0.88 inches below norm

#7. Belmont County
- Five-year precipitation average: 49.08 inches
- Precipitation over the past year: 45.19 inches (#97 rainiest year since 1895)
- Precipitation compared to 1901-2000 average: 4.41 inches above norm

#6. Pike County
- Five-year precipitation average: 50.89 inches
- Precipitation over the past year: 42.20 inches (#71 rainiest year since 1895)
- Precipitation compared to 1901-2000 average: 1.32 inches above norm

#5. Clermont County
- Five-year precipitation average: 51.04 inches
- Precipitation over the past year: 43.90 inches (#61 rainiest year since 1895)
- Precipitation compared to 1901-2000 average: 1.12 inches above norm

#4. Highland County
- Five-year precipitation average: 51.12 inches
- Precipitation over the past year: 44.26 inches (#72 rainiest year since 1895)
- Precipitation compared to 1901-2000 average: 1.79 inches above norm

#3. Monroe County
- Five-year precipitation average: 51.61 inches
- Precipitation over the past year: 47.40 inches (#100 rainiest year since 1895)
- Precipitation compared to 1901-2000 average: 5.13 inches above norm

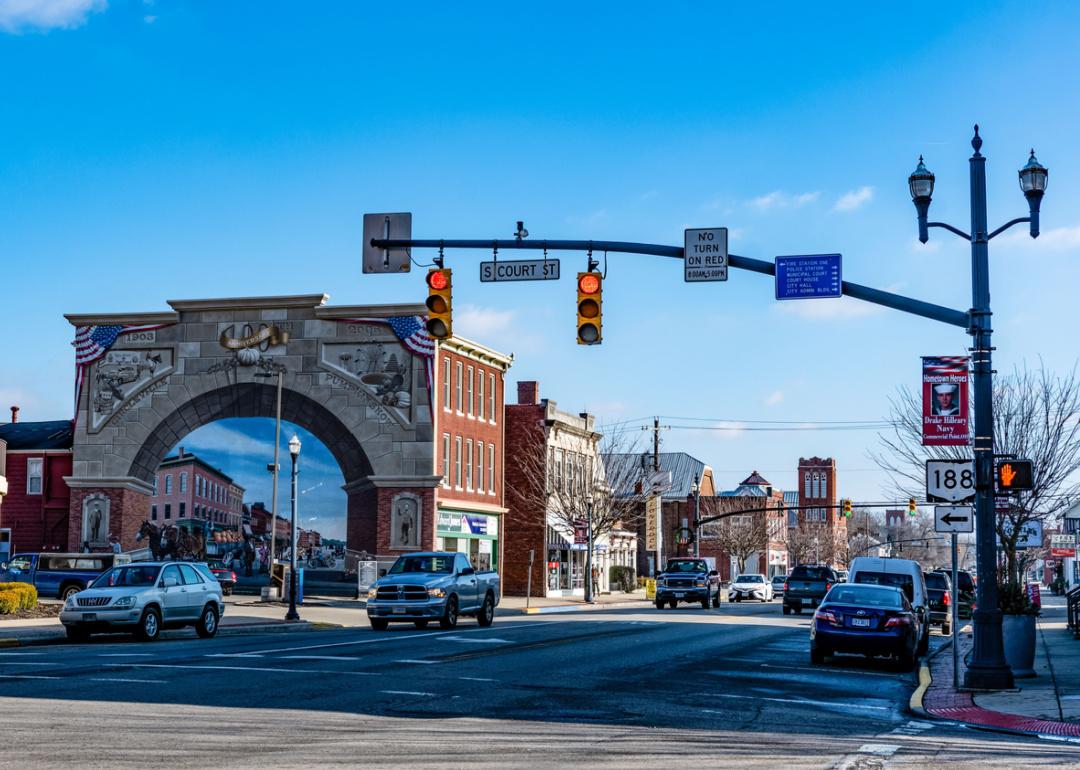
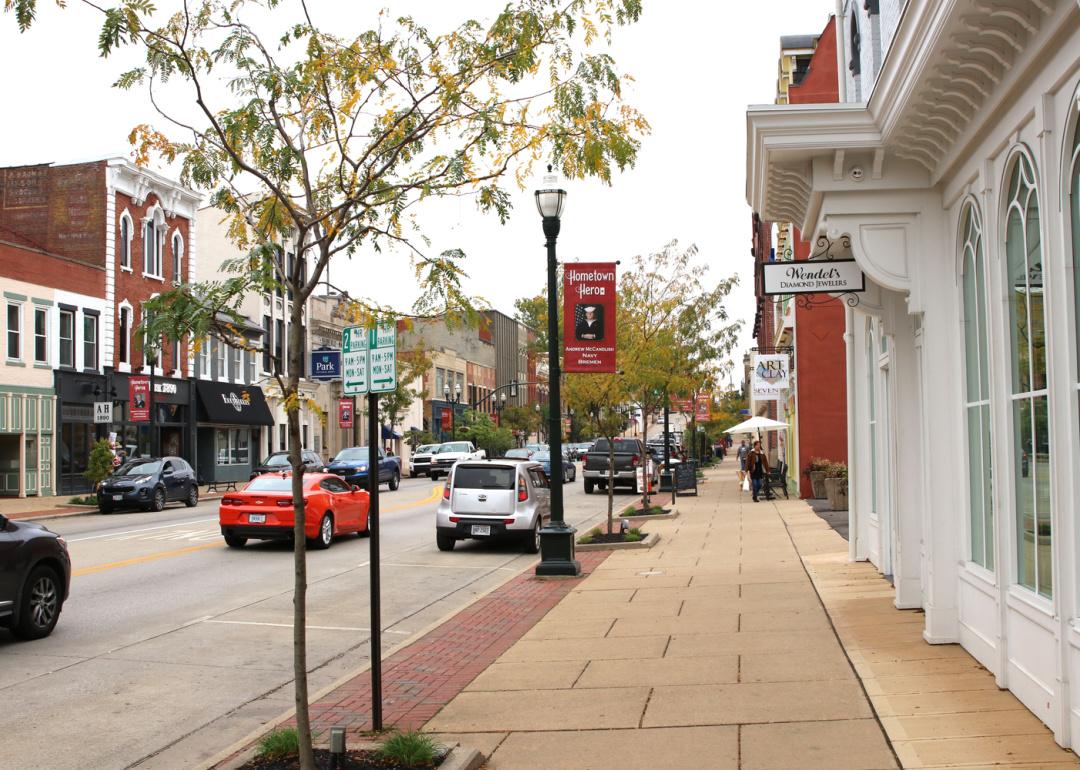
#2. Brown County
- Five-year precipitation average: 52.37 inches
- Precipitation over the past year: 45.70 inches (#73 rainiest year since 1895)
- Precipitation compared to 1901-2000 average: 2.31 inches above norm

#1. Adams County
- Five-year precipitation average: 53.11 inches
- Precipitation over the past year: 45.88 inches (#82 rainiest year since 1895)
- Precipitation compared to 1901-2000 average: 3.01 inches above norm